How Lidar Maps Ancient Sites, From Maya Cities to Chaco
A laser scanner on a small plane can map the ground beneath a rainforest in a few days. Here is how the technology works, what it has shown about the Maya and Chaco, and where it stops.
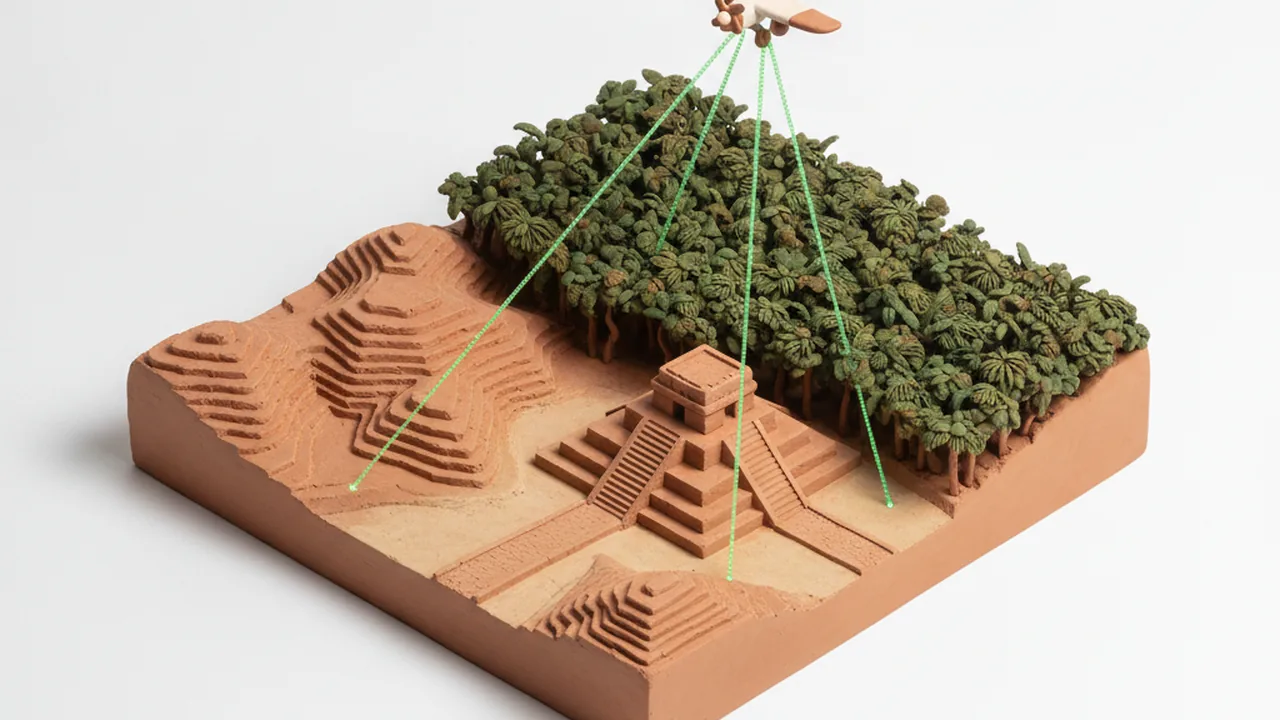
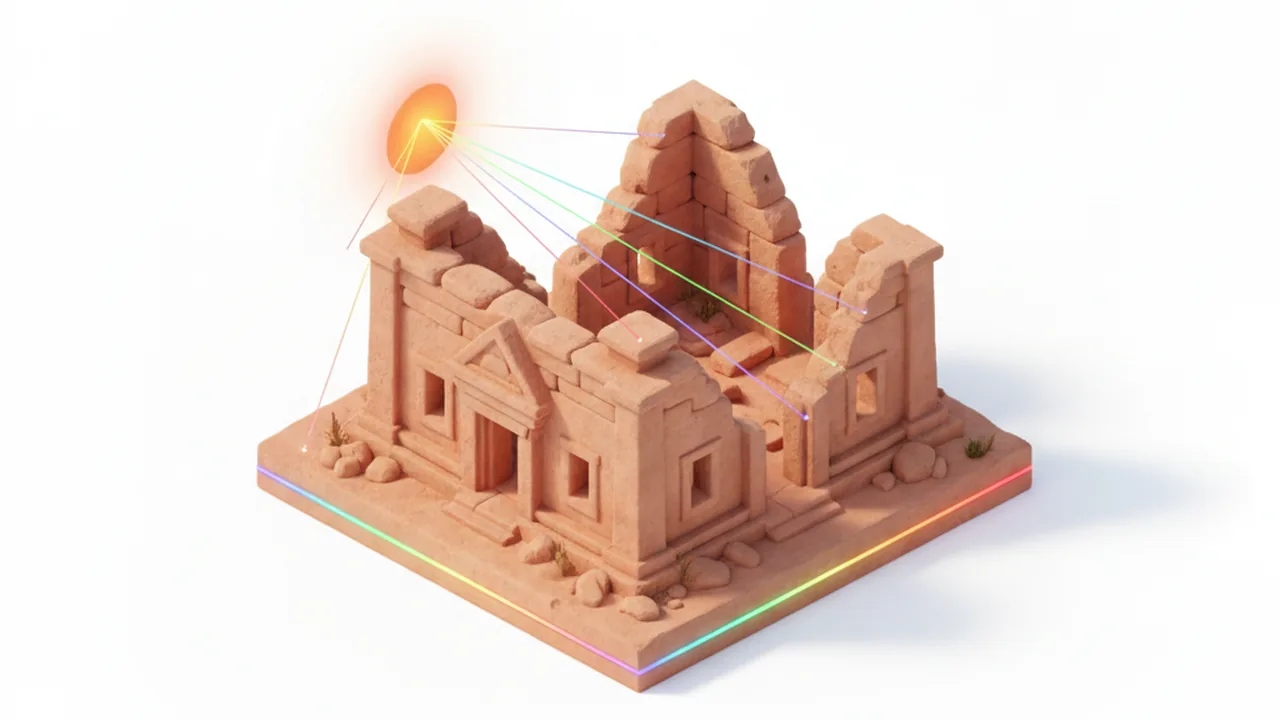
Lidar (light detection and ranging) maps ancient sites by firing hundreds of thousands of laser pulses per second from an aircraft or drone and timing each echo. Some pulses slip through gaps in the forest and bounce off the ground. Software then strips away the trees and leaves a bare-earth model in which house mounds, plazas, causeways and terraces stand out. Since 2009 this method has redrawn the map of the Maya lowlands, and it has traced ancestral roads around Chaco Canyon in New Mexico.
The flight is only the first step. A single survey produces billions of points, and turning them into a map an archaeologist can read means classifying, filtering, storing and versioning huge files. That work looks a lot like the pipelines built by firms that offer data management services for any field drowning in sensor data. This guide follows the whole chain, from laser pulse to published discovery.
Lidar also matters for archaeoastronomy. A good terrain model gives the true horizon around a site, which is exactly the input you need to calculate a sunrise azimuth and test whether a building faced the solstice Sun.
Key takeaways
- Lidar measures distance with laser pulses; a small share reaches the ground through the canopy, and those ground returns become a bare-earth terrain model.
- The 2018 PACUNAM survey of 2,144 km² in northern Guatemala found 61,480 structures and 362 km of causeways.
- Lidar shows shape, not age or meaning: every feature still needs ground checks, dating and, where relevant, the voices of descendant communities.
How does lidar work?
A lidar sensor sends out short pulses of near-infrared laser light and measures how long each one takes to come back. Light travels about 30 cm per nanosecond, so the round-trip time gives the distance to whatever the pulse hit.
On its own, a distance is not a map. Airborne systems combine three instruments:
- The laser scanner sweeps pulses side to side beneath the aircraft, often hundreds of thousands per second.
- A GNSS receiver (the general name for GPS and similar systems) fixes the aircraft's position, corrected against base stations on the ground.
- An inertial measurement unit records the aircraft's roll, pitch and heading many times per second.
Combining the three gives every echo a latitude, longitude and elevation. The result is a point cloud: millions or billions of dots in 3D space, stored in the LAS format or its compressed version, LAZ.
The key trick for archaeology is the multiple return. When a pulse hits a forest, part of it reflects from the top leaves, part from branches, and sometimes a last fragment from the soil. The sensor records each of those echoes. The last returns are the ones archaeologists care about most.
How can lidar see through a forest canopy?
It does not see through leaves; it sees between them. Even a dense tropical canopy has small gaps, and with enough pulses some light always reaches the floor. In a thick rainforest only a small fraction of pulses produce a ground return, so archaeological surveys fly low and slow and overlap their flight lines to raise the density.
Density is quoted in points per square meter. A national elevation survey may be fine for rivers and roads at a few points per square meter. Finding a low house platform under forest needs far more ground hits, which is why projects in the Maya area commission their own high-density flights.
There are three common platforms:
| Platform | Typical use | Strength | Limit |
|---|---|---|---|
| Airborne (plane or helicopter) | Regional surveys of hundreds or thousands of km² | Covers huge areas in days | Expensive per flight; needs permits and good weather |
| Drone (UAV) lidar | Single sites and valleys | Very high density, flexible timing | Small area per battery; line-of-sight rules |
| Terrestrial (tripod) scanner | Buildings, rock art, excavation trenches | Millimeter-level detail of standing walls | Sees only what is in view of the tripod |
How is raw lidar turned into an archaeological map?
Most of the effort happens after the plane lands. A typical processing chain has five stages:
- Georeferencing and strip alignment. Flight lines are matched to each other and to ground control points so that overlapping strips agree to a few centimeters.
- Classification. Algorithms label each point as ground, vegetation, building, water or noise. The standard ASPRS scheme reserves class 2 for ground.
- Bare-earth model. The ground points are interpolated into a digital elevation model (DEM), a grid where each cell holds a height. Archaeological DEMs often use cells of 0.5 to 1 meter.
- Visualization. Raw elevation shows hills but hides subtle features. Analysts compute derived images: hillshade, slope, local relief models, sky-view factor and openness. The free Relief Visualization Toolbox, developed in Slovenia, bundles many of these.
- Interpretation and ground truth. Specialists mark possible features, then field teams walk to a sample of them to confirm what is really there.
The software is largely open. PDAL and LAStools handle point clouds, CloudCompare displays them in 3D, and QGIS or Whitebox Tools turn them into maps. A regional survey can run to terabytes, so data storage, tiling and backups are a real part of the budget.
What has lidar revealed about the Maya?
The Maya lowlands are the clearest case of lidar changing a whole field. Dense forest had hidden most of the settlement between the famous ceremonial centers. Four surveys show how fast that changed.
- Caracol, Belize (2009). Arlen and Diane Chase flew about 200 km² around Caracol. In days, the survey showed terraces, roads and houses that decades of walking had only partly recorded.
- PACUNAM Lidar Initiative, Guatemala (2016, published 2018). Marcello Canuto and colleagues reported in Science on 2,144 km² of the Maya Biosphere Reserve: 61,480 structures, 362 km of causeways, fortifications and extensive wetland fields. They estimated the Late Classic lowland population at roughly 7 to 11 million.
- Aguada Fénix, Tabasco (2020). Takeshi Inomata's team first spotted the site in low-resolution lidar released by Mexico's statistics agency, INEGI, then flew high-resolution scans. Writing in Nature, they described an artificial platform about 1,400 m long, built around 1000 to 800 BCE: the oldest and largest monumental structure known in the Maya area.
- Valeriana, Campeche (2024). Luke Auld-Thomas reanalyzed lidar collected years earlier for forest-carbon monitoring and identified a dense city with pyramids and plazas. The find showed how much archaeology hides in data gathered for other purposes.
The northern Yucatán has its own lidar work. Surveys in the Puuc hills, near Uxmal and Kabah, mapped settlement and the sacbeob (raised white roads) that tie towns together. For the astronomy of those cities, see Maya solar observatories of the Yucatán.
How does lidar help archaeoastronomy?
Lidar lets researchers measure the orientation of many buildings at once instead of surveying them one by one. That changes the statistics of alignment studies.
In 2023 Ivan Šprajc, Takeshi Inomata and Anthony Aveni published an analysis of lidar data for 415 ceremonial complexes along Mexico's Gulf Coast and in the western Maya lowlands, dating from about 1100 BCE to 250 CE, in Science Advances. Most were oriented to sunrise or sunset on dates that fit the 260-day ritual calendar. Their data pushed the evidence for that calendar back centuries before its first written record.
For alignment studies, that buys three things.
- Bearings at scale. The long axis of a platform can be read straight from the DEM, with the same reference to true north for every site.
- True horizons. A terrain model gives the altitude of the skyline in any direction, which shifts sunrise azimuths by a degree or more at canyon sites.
- Context. A map of a whole region shows which buildings share an orientation and which do not, so a single striking alignment can be weighed against the background.
Lidar measures orientation; it cannot prove intent. Researchers still need the cultural record to make that case, as our guide on testing an ancient sun alignment explains.
What has lidar shown at Chaco Canyon?
At Chaco, lidar has mapped the ancestral Pueblo roads. Researchers from the Solstice Project, the group founded by Anna Sofaer, used it to document the Great North Road and the landscape around Pueblo Alto.
Chaco is a desert, not a forest, so the problem is different. The roads that radiate from the canyon are often faint shallow swales or low berms, easy to miss on the ground and in photographs. The 2017 Solstice Project study in Advances in Archaeological Practice showed road segments, ramps and stairways cut into cliffs more clearly than earlier aerial photos had. The data support the long-standing idea that the Great North Road runs remarkably straight across country, close to true north.
Chaco is also a place of living importance to Pueblo and Diné communities, which is one reason the National Park Service limits where visitors can walk. For what the alignments mean on the ground, read our site-by-site guide to Chaco's solar alignments.
Is AI now finding ancient sites in lidar?
Partly. Manual interpretation of thousands of square kilometers takes months, so research groups train machine-learning models, usually convolutional neural networks, to flag likely mounds, platforms and terraces in lidar visualizations. Some teams have released labelled Maya lidar datasets so that others can train and compare models.
The results are useful but uneven:
- Models are good at common, regular shapes such as house platforms.
- They produce false positives on natural knolls, quarry pits and modern field edges.
- They struggle with rare or unusual monuments, which are often the most interesting ones.
In practice AI works as a first filter. A specialist reviews what the model flags, and field teams verify a sample. Claims that "an AI discovered a lost city" usually mean a model highlighted candidates that people then checked.
What can't lidar do?
Headlines about "lost cities" rarely mention what the laser misses. Six limits come up again and again.
| Limitation | Why it matters | What fills the gap |
|---|---|---|
| No dates | A Preclassic and a Postclassic mound can look identical | Excavation, ceramics, radiocarbon |
| Surface only | Buried floors and objects leave no shape | Ground-penetrating radar, magnetometry, digging |
| No function | A platform could be a house, shrine or workshop | Artifacts, architecture, ethnography |
| Vegetation limits | Very dense low growth blocks ground returns | Denser flights, drone lidar, field survey |
| Cost and permits | Regional flights need aircraft time, permits and processing budgets few projects have | Reuse of government and environmental data |
| Exposure risk | Detailed maps can guide looters | Restricted coordinates, controlled data sharing |
There is also a question of voice. Lidar can map a landscape in a week, but the people whose ancestors built it have their own knowledge of it. Maya communities in Mexico and Guatemala and Pueblo nations in the Southwest are not footnotes to these maps. Good projects work with them on what is surveyed, how results are described and which data stay private.
How can you explore lidar data yourself?
You can look at real lidar without a plane or a budget. Start with these steps:
- Find a dataset. In the United States, the USGS 3D Elevation Program publishes lidar through The National Map. OpenTopography hosts many research point clouds and DEMs. For Mexico, INEGI publishes lidar-derived elevation models.
- Start with a DEM, not a point cloud. Download a ready-made bare-earth model for an area you know, such as a park or a river valley, and open it in QGIS.
- Make two visualizations. Create a hillshade, then a slope or sky-view factor image, and compare which features each one shows.
- Try a point cloud. Open a small LAZ tile in CloudCompare and color it by classification to see ground, trees and buildings separate.
- Read the horizon. Draw a profile line toward the east and note the skyline altitude. That is the number you need for an accurate sunrise calculation.
- Respect the sites. Do not share coordinates of unrecorded features you think you see; report them to the relevant heritage agency instead.
To see how the Sun meets a real horizon without any processing, open the Chaco viewer or the Yucatán viewer and pick a date.
Frequently asked questions
Can lidar see through trees?
Not through leaves, but between them. A small share of each laser pulse slips through gaps in the canopy and returns from the ground. With enough pulses per square meter, those ground returns add up to a detailed terrain model.
Can lidar see underground or find buried artifacts?
No. Lidar measures surfaces. It finds buried structures only when they leave a shape on the ground, such as a mound, wall line, terrace or road bed. Objects below the surface need excavation, ground-penetrating radar or other geophysics.
Can lidar date a site?
No. A lidar map shows form, not age. Structures from different centuries can look the same, so dating still comes from excavation, ceramics and radiocarbon samples.
Where can I download free lidar data?
In the United States, the USGS 3D Elevation Program publishes lidar through The National Map, and OpenTopography hosts many research datasets. Mexico's statistics agency INEGI publishes lidar-derived elevation models for parts of the country.
Why don't researchers publish exact coordinates of new sites?
To protect them. Detailed maps can guide looters to unexcavated mounds, and some places remain culturally important to descendant communities. Many projects share coarse locations publicly and fine data only with permits.